Week 10: Circling back
Note: Week 10 covers March 23 through 29 of 2026
Image segmentation
I’m working on a side project related to the problem of image segmentation. There’s a working implementation of OpenCV subroutines that manages a decent result, but we’re looking into ways to improve it. Besides computer vision, I will have to deepen my knowledge of statistics, as we plan on comparing the real distribution of the objects, measured with a callipers, with the computed one.
On Tuesday, the project lead created the first data set of images with their corresponding measurements. They had transferred the photographs from their smartphone to their computer using WhatsApp with the HD quality setting. Unbeknownst to them, WhatsApp had apparently compressed the images to around ⅓ of their original size. To circumvent this limitation, they uploaded the images over to OneDrive. This seems to have fixed the issue, though the files do not match the filename convention.
They gave me access to the GitHub repository that contains the work done by the previous intern. I will have to read it and understand it before doing any work, as I had never used OpenCV before this venture.
(Even though I’m not legally binded by a non-disclosure agreement, I’d rather err on the safe side regarding the details.)
Travel-time Cartograms
I met with my boss last week on Thursday for a general discussion of my internship so far. Besides strictly personal matters, I broached the topic of the Voronoi diagram map of the public libraries, first discussed in the third week.
Once again, he demonstrated how to build a Voronoi diagram using its dual, the Delaunay triangulation (same technique as this YouTube video). He brought up the idea of using contour lines to improve the visualization. Going even further, he proposed using the heat method for distance computation to calculate the geodesic distance, which could take elevation into account.
(See Crane, Keenan, Clarisse Weischedel, and Max Wardetzky. 2017. ‘The Heat Method for Distance Computation’. Communications of the ACM 60 (11): 90–99. https://doi.org/10.1145/3131280.)
Along the same lines, I remembered anamorphic maps. Specifically, cartograms. Cartograms are maps that distort the proportions of regions of space so as to convey extra information about a metric. In this case, that would be the travel-time. Luckily for us, there’s a 2018 paper that explains how to design travel-time cartograms:
Wang, Lina, Linfang Ding, Jukka M. Krisp, and Xiang Li. 2018. ‘Design and Implementation of Travel-Time Cartograms’. KN - Journal of Cartography and Geographic Information 68 (1): 13–20. https://doi.org/10.1007/BF03545340.
I might read this in the future.
Meeting with my boss
A week later, this week, I had a weekly check with my boss. I had to be honest: the problem was harder than I expected.
I told him that, quite frankly, I felt stupid.
He laughed, somewhat amused, and told me it’s OK to feel stupid.
In fact, there’s a 2008 paper called “The importance of stupidity in scientific research” which addresses this precise feeling. The one-page paper says that we feel stupid doing research because there isn’t a clear-cut path as is the case for textbook exercises, say. I would strongly recommend this paper to anyone who’s feeling the same way.
He suggested I break down the problem into 5 parts:
-
Get the data:
-
Either this map I had lost (see below), but which I had linked to in one of the blog entries, luckily.
-
Or randomly generated points.
-
-
Use SciPy to create the Voronoi polygons.
-
Crop the resulting polygons so they’re all bounded.
-
Check which points belong to the polygon.
-
Visualize them using Matplotlib.
Here’s the map of the libraries:
Emphasis Track
I had a meeting with professor Andrés Sicard Ramírez to discuss the possibility of pursuing the Emphasis Track of Computational Mechanics. He gave his informal approval and sent me on my way to submit some paperwork and schedule a meeting.
Oh, and he also gifted me his poster on computability and undecidability:
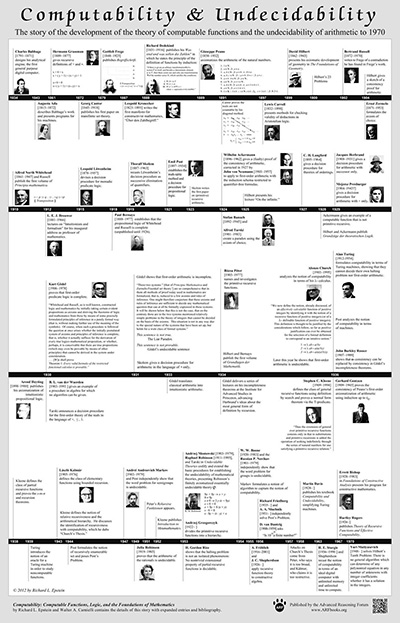
Computability and Undecidability - A Timeline: The story of the development of the theory of computable functions and the undecidability of arithmetic to 1970.
How cool is that? :)